
| 일 | 월 | 화 | 수 | 목 | 금 | 토 |
|---|---|---|---|---|---|---|
| 1 | 2 | 3 | 4 | 5 | 6 | |
| 7 | 8 | 9 | 10 | 11 | 12 | 13 |
| 14 | 15 | 16 | 17 | 18 | 19 | 20 |
| 21 | 22 | 23 | 24 | 25 | 26 | 27 |
| 28 | 29 | 30 | 31 |
- 태블로
- tableau
- 파이썬
- diary
- openAI
- Q
- Python
- 데이터시각화
- 북리뷰
- r
- Ga
- 책리뷰
- AWS
- GPT
- 데이터분석
- 서평
- Adobe
- review
- 필사
- 구글애널리틱스
- 생성AI
- bigquery
- ChatGPT
- datastudio
- SQL
- daily
- AZURE
- 빅쿼리
- 챗GPT
- 데일리
- Today
- Total
가볍게 배우고 깊게 즐기고 오래 남기기
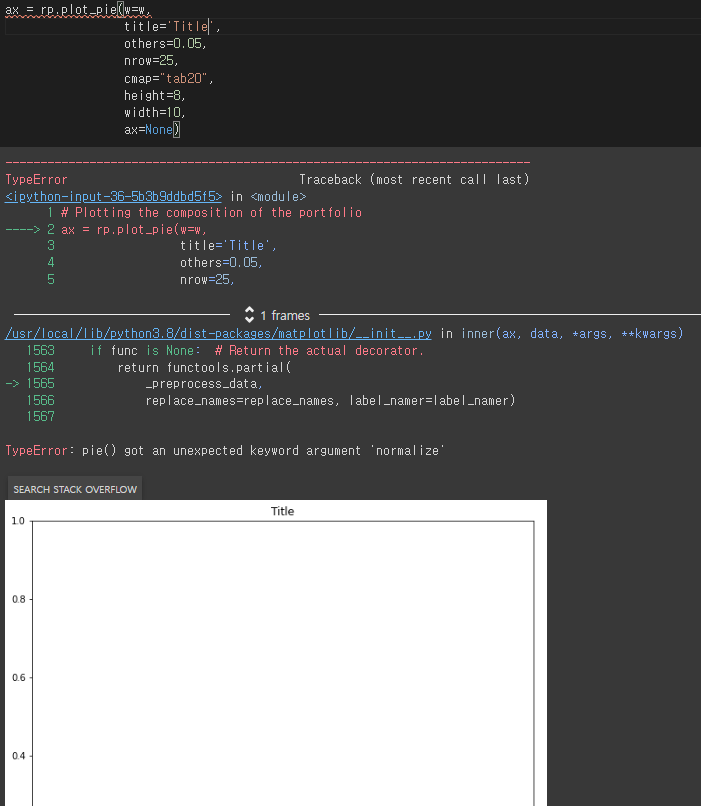
[Error] riskfolio모듈 plot pie 에러 - " pie() got an unexpected keyword argument 'no 본문
[Error] riskfolio모듈 plot pie 에러 - " pie() got an unexpected keyword argument 'no
Awesomist 2023. 1. 22. 01:48
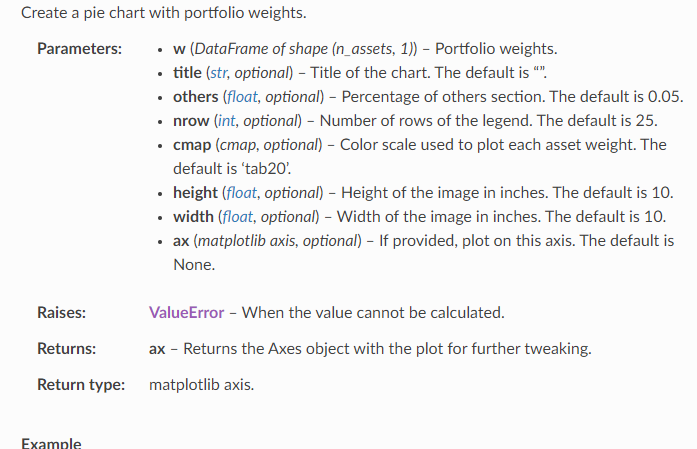
포트폴리오 최적화와 자산 배분 전략에 용이한 riskfolio 모듈에는
꽤 잘 만들어놓은 도넛차트가 있는데, 이게 Colab이나 최신화된 환경에서
우리가 보고 싶은 이 화면 공식문서의 코드를 그대로 써도 나오지 않는다.

설치할 때 잘 째려보면 matplotlib.pyplot을 사용하고 있음을 알 수 있는데
이 모듈이 참조하는 과정에서 normalize 파라미터가 문제가 있어보였다.
riskfolio모듈의 plot_pie에는 입력변수가 자체가 정의되어있지 않기 때문에 백날천날 이 함수의 파라미터로 두드려봐야 큰 의미가 없다.
아마 개발시점의 pyplot의 개발 구조와 현 시점의 개발 구조가 달라져서인 듯 한데,
애석하게되 단순히 기존 matplotlib을 삭제하고 과거 버전으로 회귀한다고 해서 해결되지 않는다. (이미 다 해봄)
그래서 직접 원본 소스를 까서 normalize를 찾아보기로 했다.
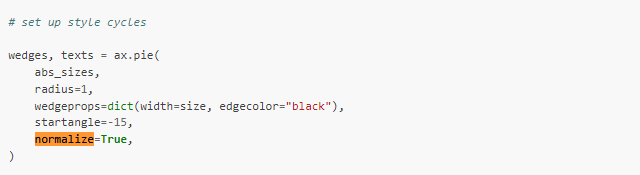
normalize를 None으로 해도 같은 에러가 반복되는 것을 확인해서 이 코드 자체를 무효화 시키기고
아예 내 코드 내에서 함수를 재정의해서 접근하기로 한다.
기존의 Plot_pie가 import하는 영역들을 체크하고 필수적으로 넣어줘야 하므로
원본 소스를 쓱 훑어보니 다행히 다른 커스텀 모듈없이
matplotlib.pyplot 과 cm, colors 정도만 사용하는 것 같아서 해당 두 개 모듈만 취하고 나머지는 고민없이 삭제한다.
1) 모듈의 plot_pie을 변경해 사용자정의함수 정의하기
★ ( ↓ ) plot_pie 재정의 코드 펼치기
(Code)
# Plot_pie 코드를 일부 변경해 적용한 코드
# 기존의 Plot_pie가 import하는 영역들을 체크하고 필수적으로 넣어줘야 함


import matplotlib.pyplot as plt
from matplotlib import cm, colors

def plot_pie(
    w, title="", others=0.05, nrow=25, cmap="tab20", height=6, width=8, ax=None
):

    if not isinstance(w, pd.DataFrame):
        raise ValueError("w must be a DataFrame")

    if w.shape[1] > 1 and w.shape[0] == 0:
        w = w.T
    elif w.shape[1] > 1 and w.shape[0] > 0:
        raise ValueError("w must be a column DataFrame")

    if ax is None:
        ax = plt.gca()
        fig = plt.gcf()
        fig.set_figwidth(width)
        fig.set_figheight(height)
    else:
        fig = ax.get_figure()

    labels = w.index.tolist()
    sizes = w.iloc[:, 0].tolist()
    abs_sizes = [np.absolute(s) for s in sizes]
    sizes2 = pd.DataFrame([labels, abs_sizes, sizes]).T
    sizes2.columns = ["labels", "abs_values", "values"]
    sizes2 = sizes2.sort_values(by=["abs_values"], ascending=False)
    sizes2.index = [i for i in range(0, len(labels))]
    sizes3 = sizes2.cumsum()
    sizes3["abs_values"] = sizes3["abs_values"] / sizes3["abs_values"].max()
    l = sizes3[sizes3["abs_values"] >= 1 - others].index.tolist()[0]

    if l > 0:
        a1 = sizes2["abs_values"].sum() - sizes2[sizes2.index <= l]["abs_values"].sum()
        a2 = sizes2["values"].sum() - sizes2[sizes2.index <= l]["values"].sum()
        item = pd.DataFrame(["Others", a1, a2]).T
        item.columns = ["labels", "abs_values", "values"]
        sizes2 = sizes2[sizes2.index <= l]
        sizes2 = sizes2.append(item)

    abs_sizes = sizes2["abs_values"].tolist()
    sizes = sizes2["values"].tolist()
    labels = sizes2["labels"].tolist()
    sizes2 = ["{0:.1%}".format(i) for i in sizes]

    if title == "":
        title = "Portfolio Composition"

    limit = np.round(np.min(sizes), 4)
    if limit < 0:
        title += " (Areas in Absolute Values)"

    ax.set_title(title)

    colormap = cm.get_cmap(cmap)
    colormap = colormap(np.linspace(0, 1, 20))

    if cmap == "gist_rainbow":
        colormap = colormap[::-1]

    cycle = plt.cycler("color", colormap)
    ax.set_prop_cycle(cycle)

    size = 0.4

    # set up style cycles

    wedges, texts = ax.pie(
        abs_sizes,
        radius=1,
        wedgeprops=dict(width=size, edgecolor="black"),
        startangle=-15
        #normalize=True        #이 부분을 무효화시킨다. None을 넣어도 동일하게 에러가 난다
    )

    # Equal aspect ratio ensures that pie is drawn as a circle.

    ax.axis("equal")

    n = int(np.ceil(l / nrow))
    if n == 0:
        n += 1

    ax.legend(wedges, labels, loc="center left", bbox_to_anchor=(1, 0.5), ncol=n)

    bbox_props = dict(boxstyle="square,pad=0.3", fc="w", ec="k", lw=0.72)
    kw = dict(
        xycoords="data",
        textcoords="data",
        arrowprops=dict(arrowstyle="-"),
        bbox=bbox_props,
        zorder=0,
        va="center",
    )

    for i, p in enumerate(wedges):
        ang = (p.theta2 - p.theta1) / 2.0 + p.theta1
        y = np.sin(np.deg2rad(ang))
        x = np.cos(np.deg2rad(ang))
        horizontalalignment = {-1: "right", 1: "left"}[int(np.sign(x))]
        connectionstyle = "angle,angleA=0,angleB={}".format(ang)
        kw["arrowprops"].update({"connectionstyle": connectionstyle})
        name = str(labels[i]) + " " + str(sizes2[i])
        ax.annotate(
            name,
            xy=(x, y),
            xytext=(1.1 * np.sign(x), 1.1 * y),
            horizontalalignment=horizontalalignment,
            **kw
        )

    try:
        fig.tight_layout()
    except:
        pass

    return ax
2) rp모듈의 plot_pie함수가 아닌 새로 정의한 plot_pie로 적용하기
| As-is | To-be |
|
ax = rp.plot_pie(w=w,
title='Title',
others=0.05,
nrow=25,
cmap="tab20",
height=8,
width=10,
ax=None)
|
ax = plot_pie(w=w,
title='Title',
others=0.05,
nrow=25,
cmap="tab20",
height=8,
width=10,
ax=None)
|
3) 최종결과 - 해결

※ 쿠팡 파트너스 활동을 통해 일정액의 수수료를 제공받을 수 있습니다.
'Programming & Tip > Python' 카테고리의 다른 글
| Python || chatGPT API 등 외부 API를 활용해 텍스트 출력할 때 줄바꿈하는 간단한 prettier 함수 (0) | 2023.08.03 |
|---|---|
| Python Tip || 환경변수 리스트를 알고싶을 때 (Let's keep it simple, 딕셔너리 필터링 검색 포함) (0) | 2023.03.29 |
| Python || 당신의 아나콘다 프롬프트에 '관리자 권한 실행'이 필요할 때 (에러 해결) (0) | 2022.07.20 |
| Python || 외부 DB에 연결용 - AWS / Netezza / Oracle / PostgreSQL / mysql (0) | 2021.10.26 |
| Anaconda Tip || Jupyter Notebook 연결 시 기본 브라우저 변경하기 (to 크롬브라우저) (0) | 2021.07.06 |


